How Our Thermal Comfort Index Works
Hey guys! It’s been 4 months since we added our new Thermal Comfort Index, and we’ve received a lot of questions about how we calculate it. Well, keep reading to find out the answer!
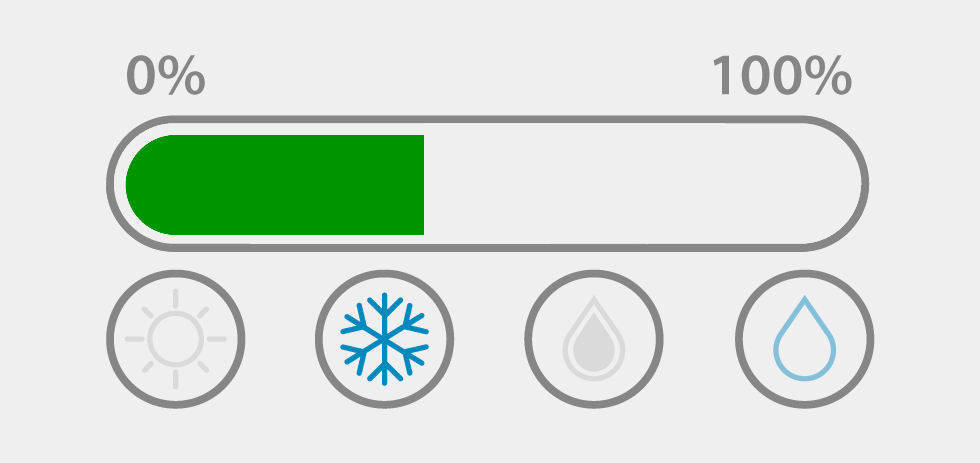
The index is meant to help you achieve the optimal thermal conditions in your home or office. It uses the data provided by your inside temperature and humidity sensor to calculate a value in a 0 to 100 scale, in which 100 represents the optimal comfort.
The temperature data received from the sensor is evaluated through a Gaussian function that tell us how far from the optimal point is the current value. This optimal point is set to 22.5ºC (72.5ºF), which is the average between the recommended room temperature in the summer and winter.
The same process takes place for the humidity. In this case, the optimal point is set to 40% RH which, again, is the average between the recommended room humidity in the summer and winter.
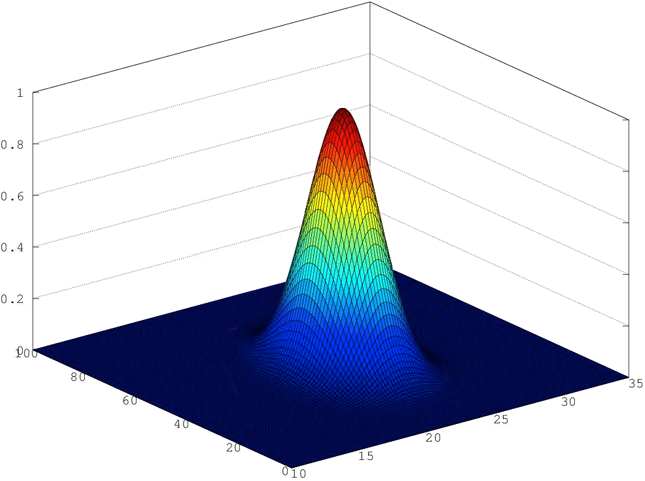
Both Gaussian functions are combined together to create a 3D plot that looks like a mountain, where the peak represents the optimal combination of temperature and humidity. The reason for using Gaussian functions is that the farther the temperature and the humidity are from the optimal point, the fastest the index decreases, which is pretty much what happens in reality, since it takes more time for your body to adapt to these conditions.
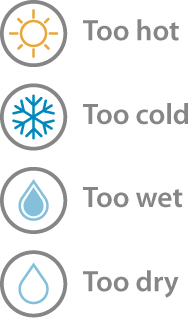
One thing we wanted to add to the index in order to help you improve your thermal comfort was a simple set of icons that tell you why it wasn’t good enough. The table below explains the meaning of each of the icons:
I hope you enjoyed the explanation and, of course, if you have any doubts or comments, send them to us and we’ll be happy to answer.
Cheers!
OK, that’s a good explanation of Thermal Comfort Index.
Two more questions:-
1) In the profile display of Weathercloud there is a sun (left of the Temperature) Ours is displaying “Not Available”? Why??
2) Hoe does Weathercloud calculate “Windchill”?
We have a Easyweather program running on Windows 7 with data from Fine Offset WH1080 (Maplin) station
Hi Toby,
1) You need to upload data of all the weather variables required to generate the present weather icon.
2) Your weather software must send us the windchill data since we do not calculate any of the weather variables.
Thank you for the information contained in this blog. It covered the information I was looking for and it will be of great assistance in setting the conditions inside.
Thanks Bruce! So glad you found this post useful!
Thanks for the really clear explanation. Very helpful.
Thank you, Marcus!
This post is helpful as far as it goes. My issue is that WeatherCloud is blocking access to my “Inside” readings. How do I access my “Inside” readings. At this stage I am still on the “Free” plan.
Hi Chris, please note that inside data is private. Ensure you are logged into your user account to access this information.
I have the same problem, after start Inside link – it shows 0