Introducing Weathercloud Beta 6

Today we’re thrilled to announce the release of Weathercloud Beta 6!
In addition to new features and enhancements included in this version, Beta 6 comes with massive changes under the hood that lay the foundation for all the future developments that we’re working on. In other words, this version is an important step towards optimal stability, scalability and performance. We hope that you love Beta 6 and, as always, we would really appreciate any feedback from you.
What’s New in Beta 6
Improved Performance
We have upgraded our servers and started to adopt big data technologies and techniques to ensure the most efficient handling possible of all the weather data. Just to give you an idea, the Weathercloud database currently has over 3 billion records that translate into more than 100 GB of space. In addition, we receive around 500,000 new records every hour from the more than 7,000 online devices. This huge and rapidly growing volume of data is a challenge that requires us to constantly rethink and improve how we manage the data in order to keep pace. The changes introduced in Beta 6 guarantee long-term stability, scalability and performance, and we’re sure that you’ll notice the boost in speed right away.
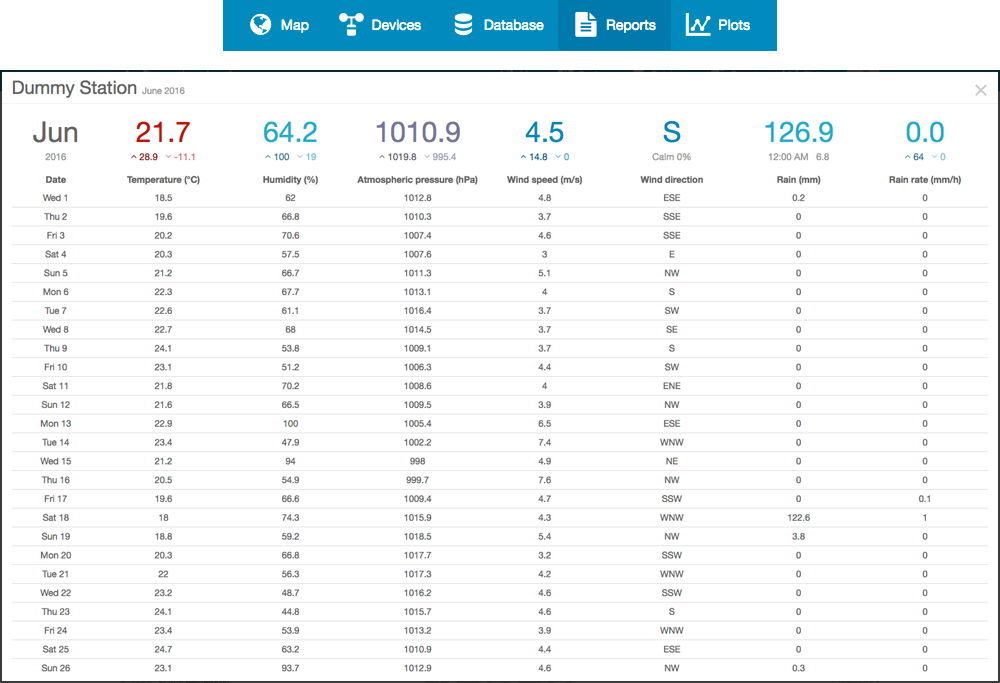
Reports
But not everything in Beta 6 is about performance. The new Reports tool is the easiest and fastest way to check the records of a specific day or month. It shows in a table the average values for each hour of the day or day of the month (depending on what you choose), as well as a nice summary with the average, maximum and minimum value for the whole selected time period. You will find the Reports tool in the header of the site, between Database and Plots. Give it a try and let us know what you think in the comments below!
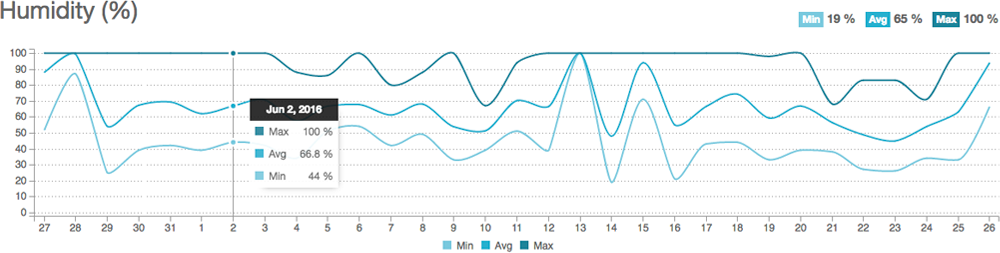
Revamped Plots
Some changes have been done to the Plots tool in order to enhance it and make it easier to use. We have switched to a new graphic library that features a more modern look and that is responsive in real time, which means that you no longer have to refresh the page in case you resize your browser window. In addition, the information is now displayed full screen, and we have highlighted the average, maximum and minimum values of each selected variable at the top of the screen and in large digits so you can check them at a glance.
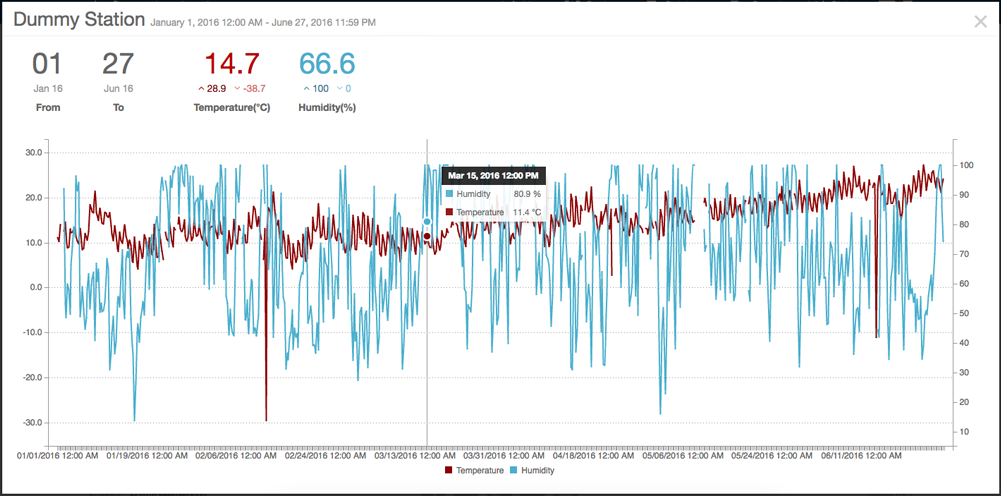
Enhanced Evolution Graphs
The Evolution Graphs on your public device page now use the same new graphic library as Plots. Thanks to that, the graphs are also fully responsive and when you hover over a dot you see the date and the maximum, average and minimum values for that day all at once, instead of just the value for that specific dot as in the prior version. This makes the Plots tool more usable and helps you save time. Finally, we have slightly adjusted the color of the lines in each graph to allow for easier differentiation between them.
Other minor bug fixes and improvements:
- Added instructions for uploading data via Cumulus MX, EasyWeather and UnderTheWX.
- Fixed an issue that caused the user device to be displayed blue instead of green on the weather map.
- Fixed an issue that caused wind speed to be displayed as as ‘Calm’ in the automatic tweets when there was no data.
- Fixed an issue that prevented unfollowing METARs from the Devices page.


The report shows bad numbers of rain. On another places the values are OK.
Thanks for your feedback Ivo! Could you please send a screenshot to support@weathercloud.net so that we can take a look?
Problem solved! ;)
Loving the plots and reports!
Thanks!
Congratulations you keep moving!
Thanks Mauricio!
Is there a option to set when rainfall daily data is reset
In Australia rail fall daily totals are reset at 9am
All reads rail fall to 9 am
Cheers
Hi Martin, currently there’s no option to set this parameter, but we’ll think of a way to implement it. The main challenge is that many weather station models reset the rainfall daily data automatically at midnight.
I am unable to plot anything. I just get the Weathercloud computing graphic but I never get a plot.
However, I like the changes, Thanks for continuing to improve this app. You have outstanding graphics!
Hi John, are you using Safari? For some reason, this browser does not support the standard data range pickers, so you need to manually enter the start and end dates. Also, make sure to change the “-” separator for a “/” as follows: 2016-06-30 -> 2016/06/30, otherwise the plot won’t show on Safari. We’ll look for a way to fix this.
Hello,
Regarding the plots, can someone tell me how the quantity Rain(mm) is calculated? From the plots, looking like bar graphs, it seems to be the accumulated rain in mm over a certain time period. But the values do not seem to make sense with the corresponding values of Rain Rate in mm/h. I get a time period of 3.6 min for rate data over one day. The rate data correspond correctly to my original WeatherCat data.
I would think that the accumulated rain added up over a period of 24h would be a more useful plot.
Regards, Irving
I’ve tried everything to get my computer to link but no matter what I try it will not link the software I’m using is Weather smart my weather station is Fine Offset WH2310, I’ve turned off all firewalls which I’m not happy about I know it’s working my end. After I beginning to feel a little frustrated.
Hi Gordon, we have reported this issue to the developers of the WeatherSmart software so that they can have a look.
Hi,
I’m unable to get Plots curve on Firefox 45.3.0 (Linux RHEL6)?
After selected 2 variables , 2 dates and clicked on the “View Button”, I just see a rose rectangle on the top of the page …
Firebug says :
POST values to https://app.weathercloud.net/plot/values
400 Bad Request
Post:
device : 0578040194
end : Invalid date
start : Invalid date
variables[1][] : 101
variables[2][] : 200
Response :
Bad request
Looks like javascript failed to get the 2 dates values (2016-09-01 and 2016-09-02)?
It fails whatever date and/or variables I try .
Thanks for your works.
Hi Dominique,
Please verify that the date format you are entering is YYYY-MM-DD.
If you are using a different format, the plot will not load.
Hello, im glad I found weathercloud because its the best looking pws site.
When do you think we will have rapid fire updates ?
Thanks.
Hi Michael, we are happy that you like our service. Yes, we plan to add a rapid fire option in the future, but still cannot give an exact date.
Hello and thanks for your reply. Is there any chance we can remove the graphics for the variables we don’t use, instead of having them still showing faded on the page ? Also can we have our inside gauges showing on the public, not logged in, pages ? Thanks
Hi Michael, that is not possible in the current version of the site, but we will consider adding these features in the upcoming updates. Thank you!
I am unable to get any response from my emails to support. What’s the issue?
I need to data to reinstall the application (username & password) in my PC that handles weather.
I keep getting messages that says my station is not reporting, which is true. However, unless you reply to my support requests (third sent earlier), it likely never will!
Hi Tom,
What information do you need exactly, your Weathercloud credentials or the ID and KEY provided for your weather station?
Thanks
After purchasing a weather station, I’m right on your side and just love this service. Also the support in setting up my station by you – exemplary.
As Michael already described on 2016-12-07, it would be great if individual unused graphics could be switched off.
Is also an app for Android planned (similar Wunderground)? Or maybe widgets for websites? That would be a great topping.
In any case, many thanks for this top service
Hi Alexander, thank you very much for joining Weathercloud.
1) You can enable/disable specific variables at any time from the Edit variables page. To do so, you need to go to the Devices page and click on Edit variables in the drop-down menu (the gear icon).
2) We will release the first Beta version of our app for both Android and iOS very soon. Stay tuned!
3) You can add your Weathercloud Sticker with the current weather to your website or forum signature. To obtain your Sticker, you need to go to the same drop-down menu as before and click on Get Sticker.
Thank you for the feedback
1,) I’ve already found the setting, but I thought that when individual graphics are off, they no longer appear on the overview pages. But they are still displayed (slightly gray).
2.) Then I’m curious and wait.
3.) Now I have found the option :-)
I live in the Netherlands and bought an Alecto WS-5500 last week and coupled it with weathercloud. As the air pressure was not correct (2% less) I corrected it and on the little screen of the Alecto it shows the correct value now (after switching the display from relative to absolute). However, weathercloud still show’s the incorrect (relative) value. Is this something you can correct in your software or does the pws only send the relative air pressure and not the corrected absolute value?
Hi Arno, thank you for joining Weathercloud. We display the same atmospheric pressure value that your weather software sends us, without any correction in our site. You software must send the sea-level atmospheric pressure.
Hello, I installed easyweather for touch screen with solar powered station, I inserted the ID and the key, I still do not see on the map for more than twelve hours. My station is well connected by usb to the computer and easyweather has accepted the weathercloud codes.
What to do ,
Thank you for your answers.
Hoarau Patrice
Hi Hoarau, could you please indicate the name of your station on Weathercloud so that we can check? Thanks!
Hello,
I have started receiving the error messages below in my Meteobridge. In the past I would only see them couple of times a day, now it seems to be all day. My data seems to be going to your site but I guess the site is not replying back that it received the data?
Site is Cedarwood in West Columbia,SC
2018-01-23 22:44:27 Error: Read error (Connection timed out) in headers. (no more tries)
2018-01-23 22:34:07 Error: Read error (Connection timed out) in headers. (no more tries)
Hi Mark,
Thank you for your feedback. In recent weeks, our service has experienced a significant growth in the number of users and devices and our team is already working to scale the server accordingly in order to restore good performance. We will keep you informed about progress shortly. Sorry for any inconvenience.
We are happy to inform you that the site is working fine again so you can resume uploading data.
Yep, looks like at 9:57 am eastern time it shows it was a success. I had set my upload to every 30 minutes, I have it back to 10 minutes now. Will check it in the morning and see how it looks. Did your growth come from WeatherUnderground having trouble?
Great, thank you for checking on this. The growth has increased meaningfully in recents weeks, coinciding with the addition of new compatible software. That is all we know for sure.
No failures yet at every 10 minutes that I can see.
Hello,
Can we share in any way an image with the current temperature of your page?
The gifs that show.
I can download them, but I would like to share them.
regards
Hi Lee, you can share your current weather data using our Weathercloud Sticker (https://blog.weathercloud.net/wp-content/uploads/blog-24-10-2014-1-4.png). If you require a specific solution for municipalities, please send us an email for more details.
Yes, we have seen this sticker, but we would like to customize it.
Is there any way that our computer can customize it, or take your gifs and show them or share them?
The Weathercloud Sticker is not customizable and the real-time gauges cannot be shared. You can use our solution for municipalities. See example: https://app.weathercloud.net/algemesi
What are the fees for this service?
Please feel free to contact us via email for more information: https://weathercloud.net/site/about
Hi.
I’m on iOS and it appears any Plot request is always met with a “Bad Request”.
Is there a fix coming?
Hi Paul, if you are using Safari please try changing the – spacers for / in the dates before plotting.
Hi. Yes, I’m using the Mobile Safari (ie my iPads main browser) however the date field are buttons, which when I click on them display a date picker widget. Once the date is selected it returns to a button with the selected date on it. There is no where to type so I can’t make your suggested change. Thoughts?
That seems to be a compatibility issue with Safari since the date pickers are working fine on other mobile browsers.
I can understand that but since most people using an iPhone or iPad will be using the built in browser, wouldn’t it be a good idea to add support for this so as to not exclude all people on iDevices?
Hi Paul, our team is already working to solve this issue. We will let you know as soon as it has been fixed. Thank you for you patience and sorry for the inconvenience.
I have the same issue and have confirmed its working on Firefox (Windows).. How likely is it that we will get a fix for Safari?
Hi Jon, we will be able to check this issue next week after our summer break.
Thanks for fixing this! The plots are awesome!
Hi – any news about likely timescales for fixing the GoogleMaps developer bug (possibly to do with needing a Google key) and when mobile apps might become available? Really liking WeatherCloud and want to make more use of it. Many thanks.
Hi Martin, we appreciate your comments about Weathercloud. A new and improved version of the weather map is on its way. The app for mobile devices will take a little longer, but we are working on it too. Regards.
Gibt es die API eines direkten Links zum übertragen der Daten?
Ähnlich wie bei
https://weatherstation.wunderground.com/weatherstation/updateweatherstation.php?ID=xxx&PASSWORD=xxx&dateutc=now&tempf='xx'& usw.
Ich lese die Station (+Feinstaub+µ-Strahlung) mit eigenem Programm aus.
Hi ralphi, yes we do have an API to upload data to the platform. Please get in touch with our Support team for more details: https://weathercloud.net/site/about#contact