Weathercloud 13 is Here: Expanded Local Forecast Coverage, More Customization Options & New Advanced Dashboards

We’re excited to announce Weathercloud 13, the latest major update to our platform. This release expands local weather forecasts to many more countries, introduces greater customization options, and adds 2 brand-new advanced dashboards. It’s all part of our ongoing commitment to delivering a more complete and personalized user experience.
Let’s take a closer look at what’s new:
🌦️ Local Forecasts Now Available in More Countries
We are thrilled to expand our 3-day weather forecast coverage to over 20 countries worldwide, made possible through the integration of trusted official data sources such as Météo-France, Germany’s DWD, Sweden’s SMHI, and many others.
As a result, devices located in regions that previously lacked forecast information can now fully benefit from this valuable feature. Whether you’re browsing the Map page and clicking on a device, or exploring a device’s detailed profile, you’ll now have instant access to accurate, localized weather forecasts that seamlessly complement the device’s real-time data.
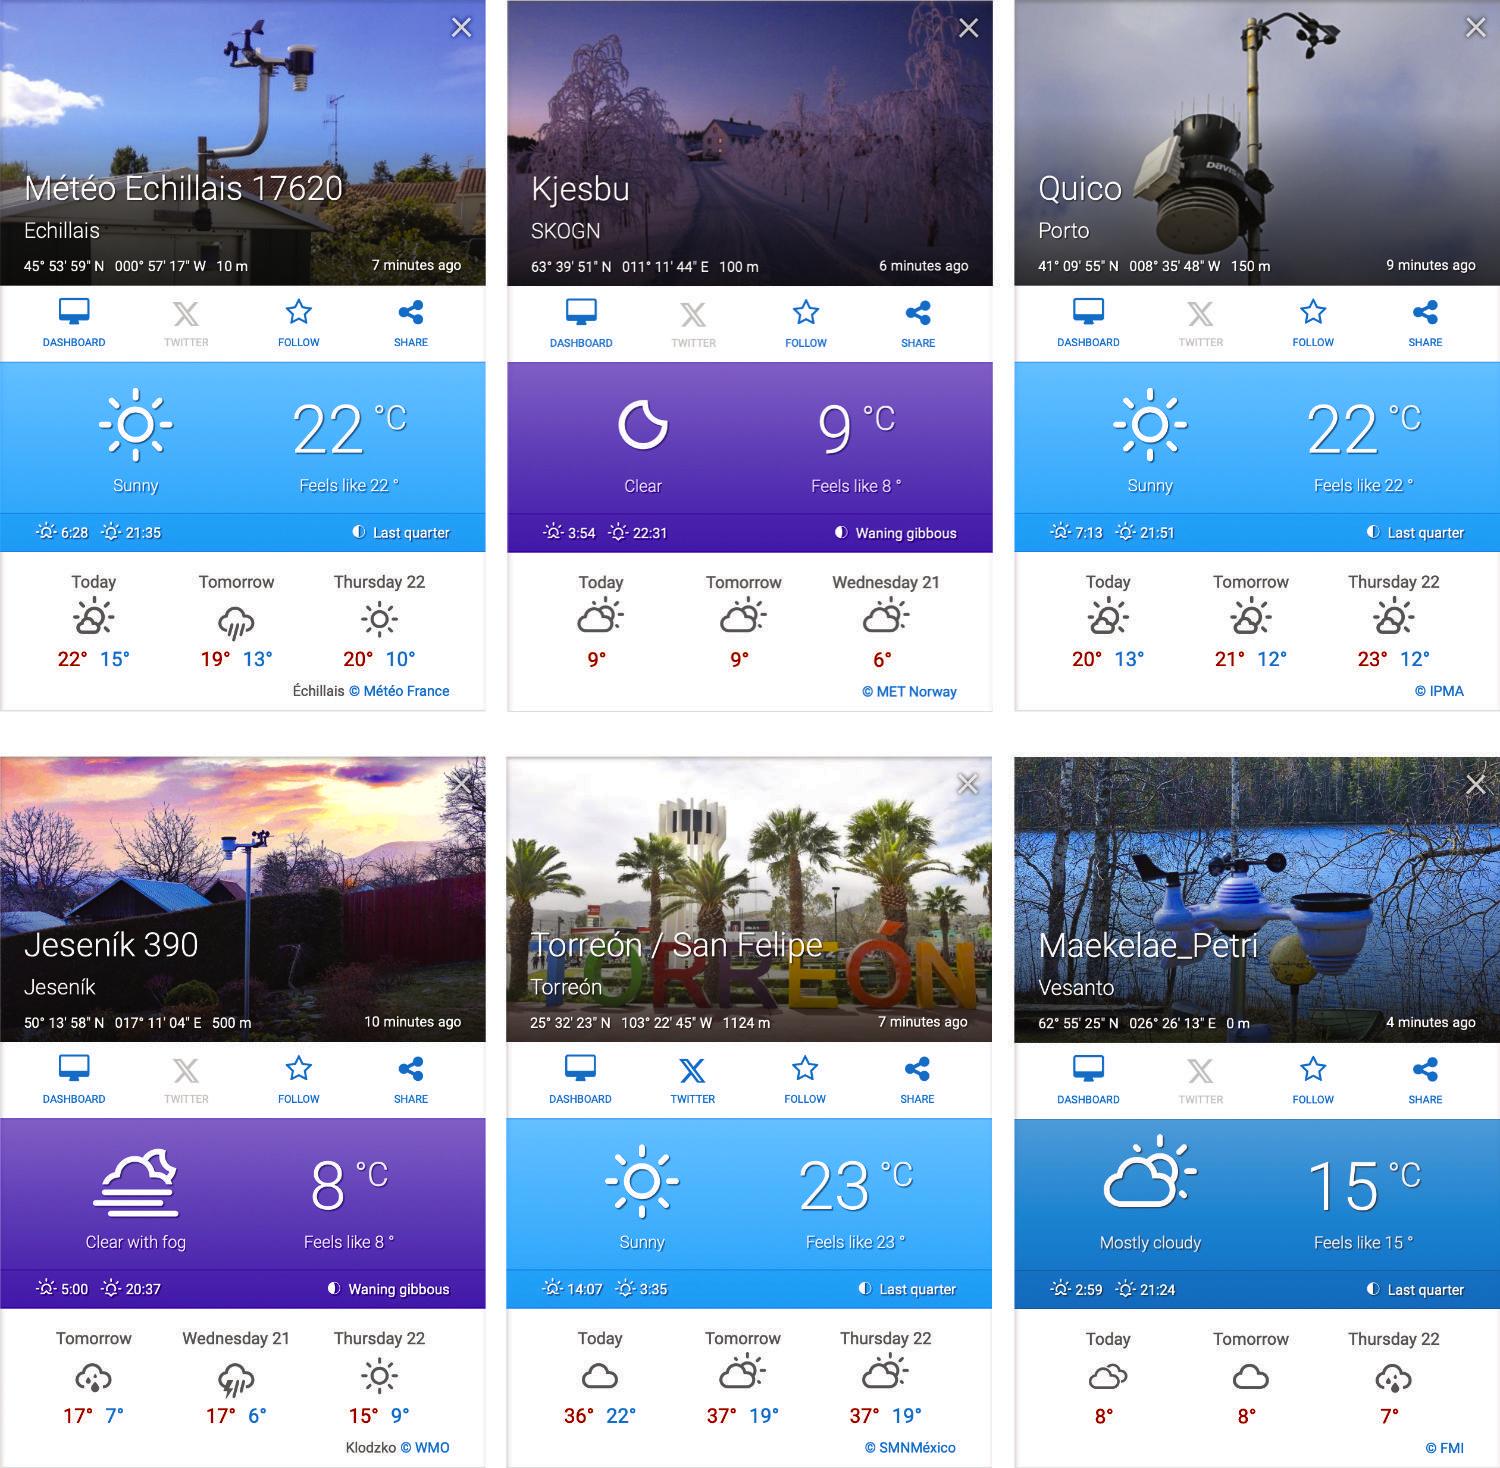
Here is the full list of countries currently covered:
- Austria (GeoSphere Austria)
- Brazil (CPTEC/INPE)
- Canada (ECCC)
- Croatia (DHMZ)
- Denmark (DMI)
- Finland (FMI)
- France (Météo-France)
- Germany (DWD)
- Iceland (IMO)
- Ireland (Met Éireann)
- Lithuania (Meteo.lt)
- Mexico (SMN)
- Norway (MET Norway)
- Portugal (IPMA)
- Slovenia (ARSO)
- Spain (AEMET)
- Sweden (SMHI)
- Switzerland (MeteoSwiss)
- Thailand (TMD)
- United Kingdom (Met Office)
- United States (NOAA)
- Other countries (WMO)
This upgrade marks a significant expansion to our forecast coverage, enriching the Weathercloud experience and empowering users worldwide to make smarter, more informed decisions.
📅 New Date and Time Format Selector
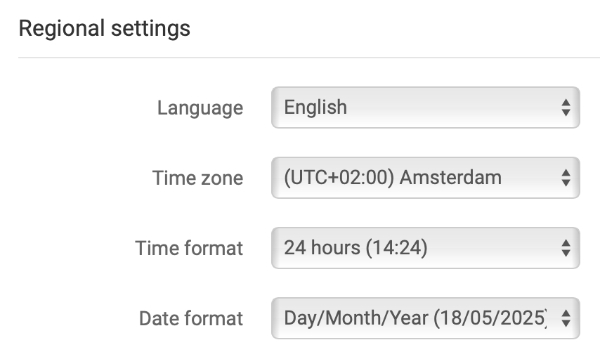
With Weathercloud 13, you now have the flexibility to choose your preferred date and time format when viewing weather data, creating a more personalized and user-friendly experience.
Previously, the date and time format was automatically determined by the selected language. For instance, choosing English always displayed the dates in the U.S. style (MM/DD/YYYY). This wasn’t ideal for users in the UK, Australia, or other regions that follow different conventions like DD/MM/YYYY.
Understanding the importance of vieweing data in a familiar format, we’ve added a simple selector on the Preferences page. Whether you prefer a 12-hour or 24-hour clock, or a day-first versus month-first date format, you can now easily customize these settings to suit your personal or regional preferences.
🎛️ More Control Over Your Additional Sensors
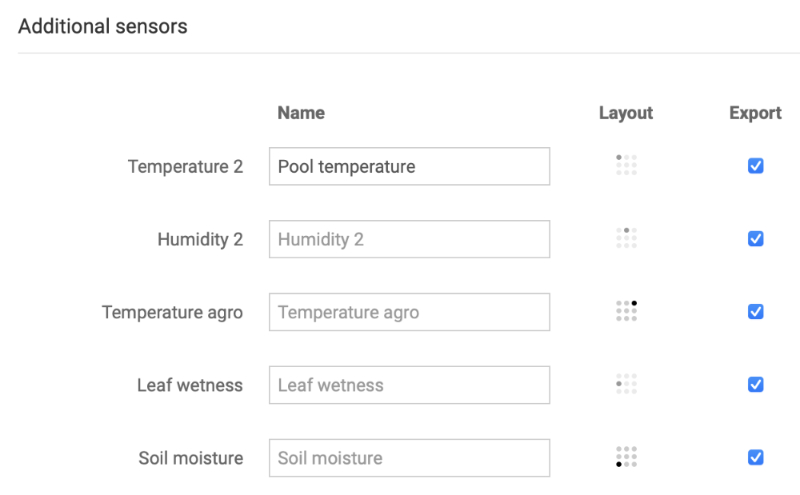
If your device includes extra sensors, such as a second temperature sensor or a soil moisture probe, you’ll love this new feature, now available on all paid plans. It offers greater flexibility to manage and customize your additional sensor data just the way you need it.
With this update, you can:
- Rename extra variables to clearly reflect their real-world use (for example, change the generic label “Temperature 2” to something more descriptive like “Pool Temperature”).
- Enable, disable, or reorder extra variables in the Extra tab to better organize and visualize your data in the sequence that works best for you.
- Choose which extra variables to export when downloading your raw data to a CSV file from the Database page, helping you streamline your data analysis and reporting. Previously, extra variables weren’t included in exports, limiting your ability to analyze your full dataset.
To access these options, simply visit the Devices page and select Edit device from the Settings drop-down menu. Managing your extra sensor data is now simpler and more powerful than ever.
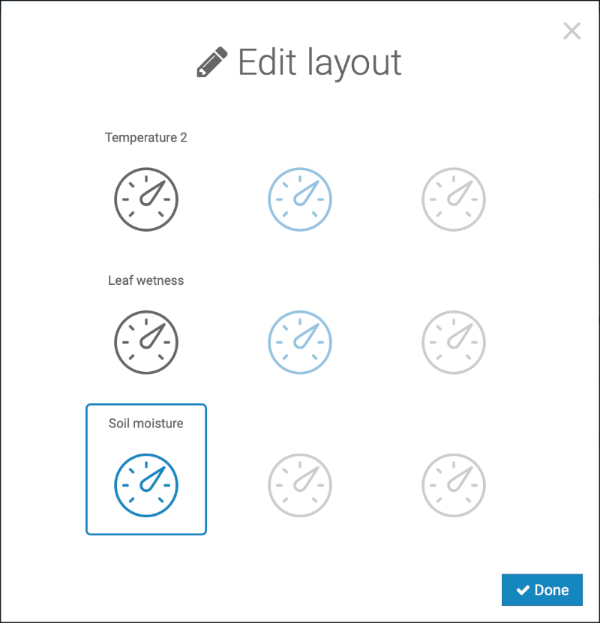
How the Edit layout feature works:
- Click the grid icon next to a variable to open the Edit layout interface.
- Select a variable by clicking on it.
- Click the selected variable again to enable/disable it, or click a blue-highlighted slot to move it to a new position.
Gray slots are locked to prevent empty gaps, helping maintain a compact and well-organized layout.
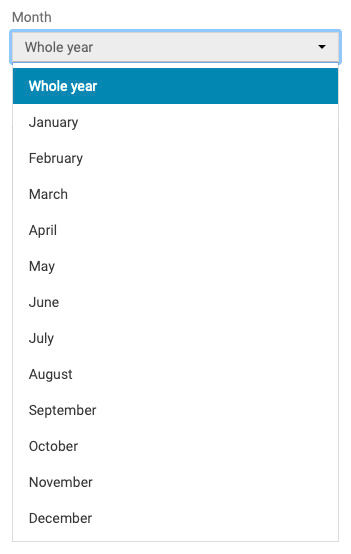
🗂️ Yearly Data Export
Weathercloud 13 introduces a highly requested feature, now available on all paid plans: the ability to export a full year of data.
Say goodbye to exporting data month by month. This new option is designed to save you time and effort, perfect for managing long-term records or performing year-end analyses.
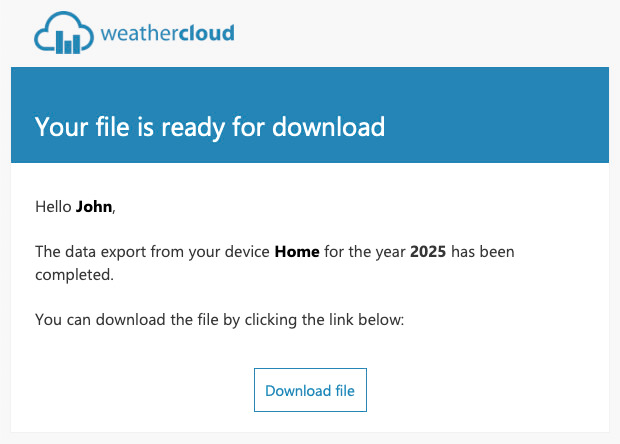
Once your export is ready, you’ll receive an email with a direct download link. Quick, simple, and efficient.
At Weathercloud, we’re dedicated to building tools that streamline your workflow, and this is just one of many exciting new features to come.
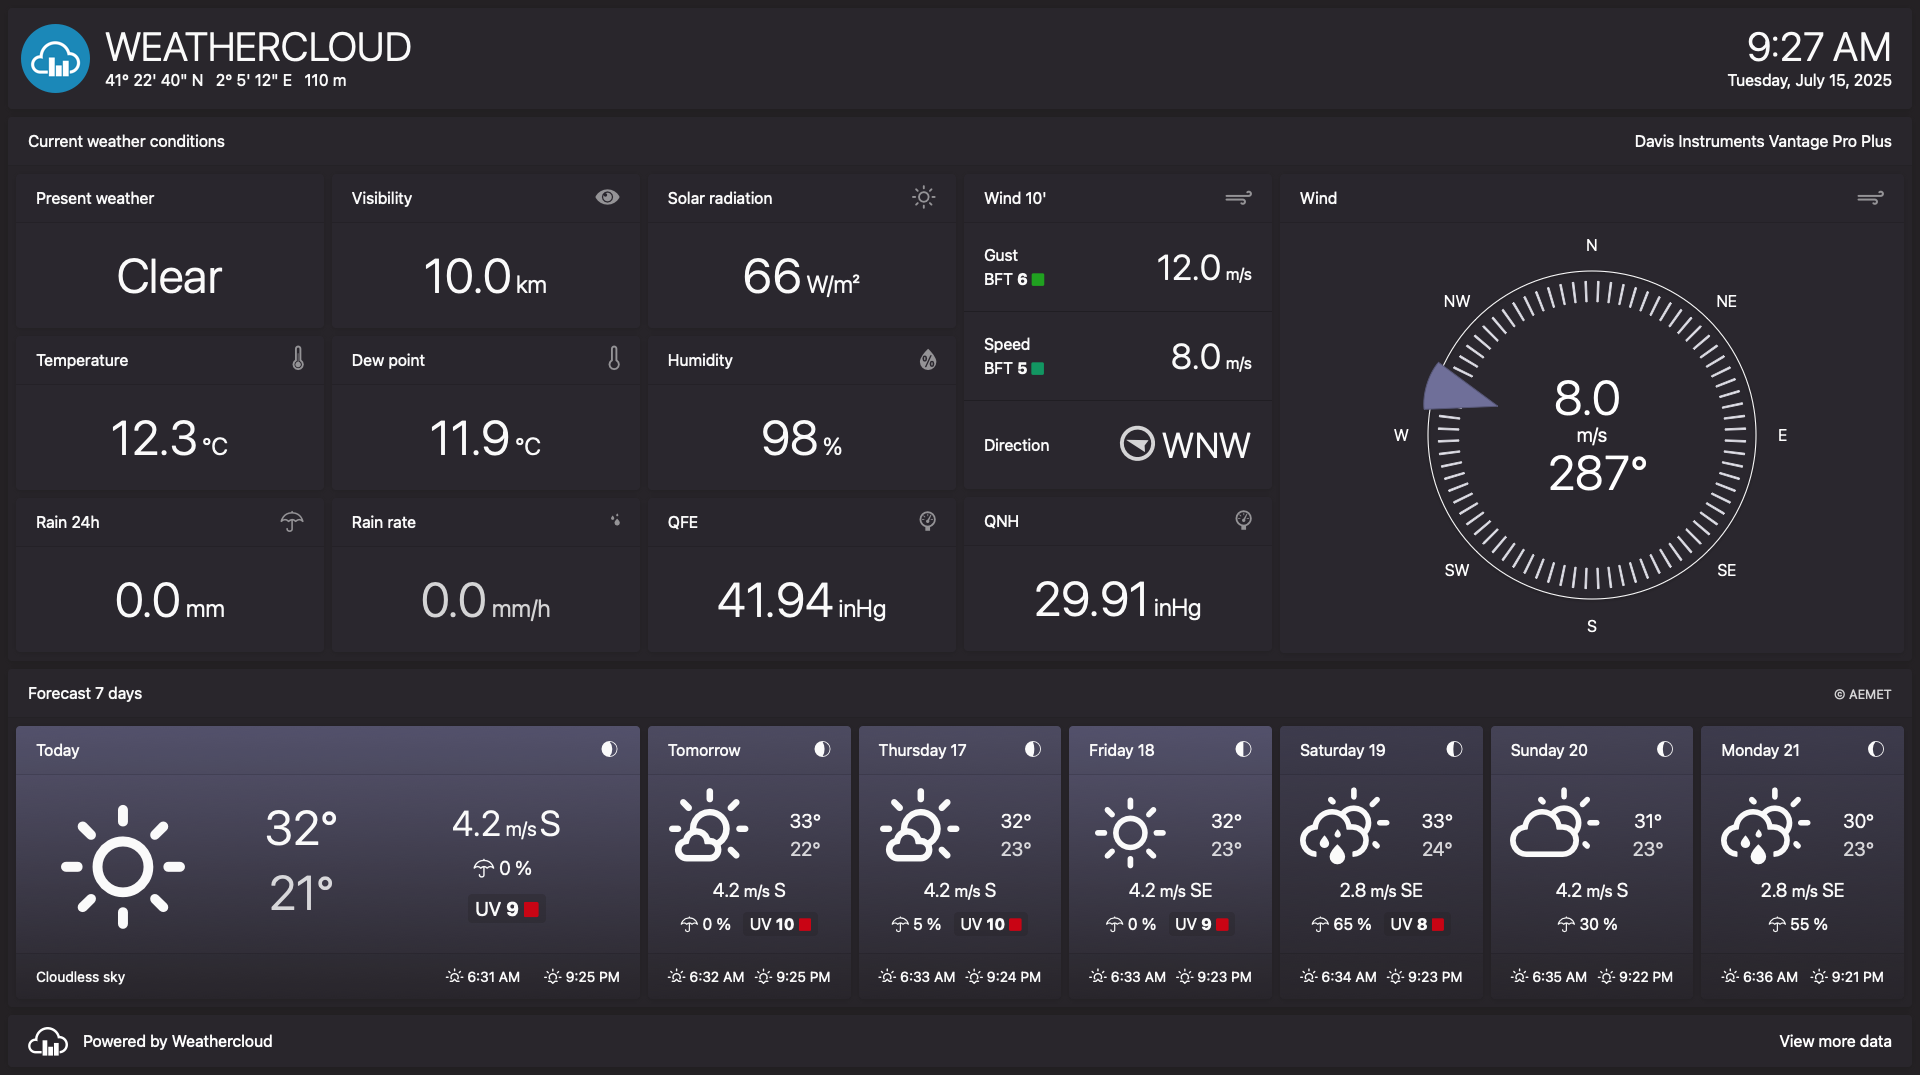
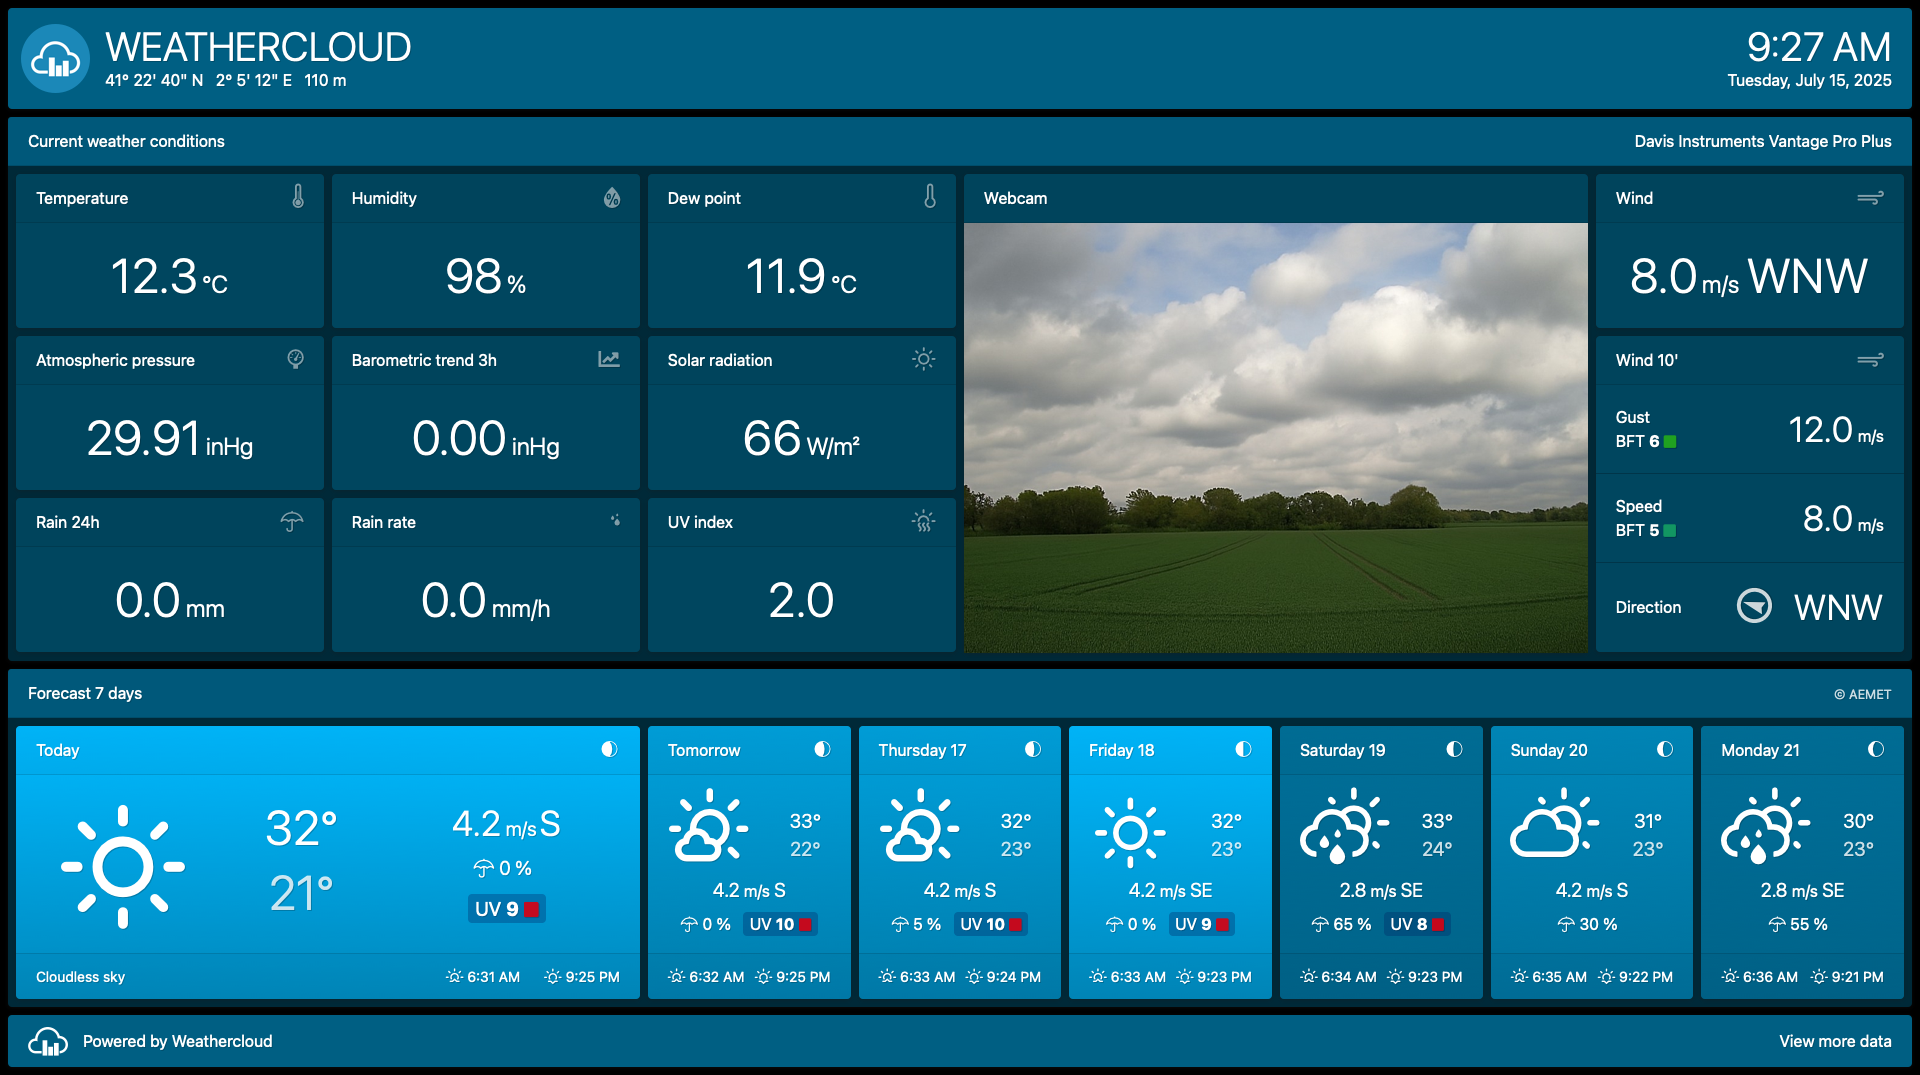
📊 New Aero and Webcam Advanced Dashboards
We’re excited to introduce 2 powerful new dashboards to the Premium plan, bringing the total number to 6 specialized dashboards: Aero, Agro (ET), Agro (Frost), Marine, Road, and Webcam.
Each dashboard is designed to display relevant weather data for specific applications:
- Aero: Built for aviation, this dashboard presents key weather information in a layout optimized for pilots, flight instructors, and flying clubs.
- Webcam: Combines your live webcam feed with real-time data from your device, offering a complete picture of current weather conditions at your location. It works seamlessly with the FTP webcam connection feature, also included in the Premium plan.
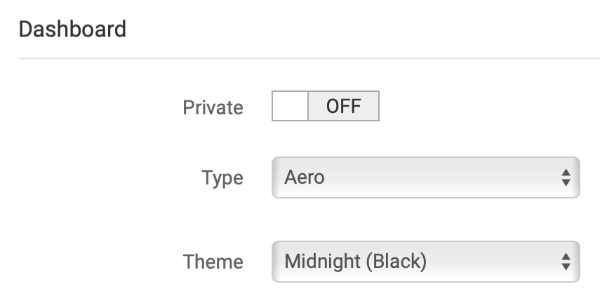
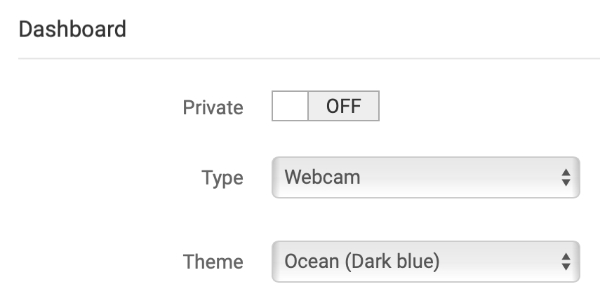
To select the dashboard that best fits your needs, go to the Devices page and select Edit device from the Settings drop-down menu. From there, you can select your preferred dashboard and customize its color palette by choosing a theme.
✨ Other improvements
This update also brings a variety of enhancements focused on boosting performance and usability:
- Bug fixes that provide a smoother, more stable experience.
- Expanded billing section with new optional fields to capture additional company details.
- Updated the old Twitter bird icon to the new X logo across the entire site.
🚀 Explore Weathercloud 13 Today!
We hope you enjoy these new features and the greater flexibility they bring. At Weathercloud, we’re dedicated to continuous improvement, making our platform more powerful and accessible for every user.
As always, your feedback and suggestions mean the world to us, so please feel free to share your thoughts in the comments below.
Keep an eye out for more exciting updates, and thanks for being part of the Weathercloud family! 💙
—The Weathercloud Team

Thank you for improving and updating the Weather Cloud app. It is an excellent product.
Thank you so much for your kind words and support, William! We’re thrilled to hear you’re enjoying the improvements. We’re constantly working to make Weathercloud even better, and feedback like yours truly means a lot to us.
Hi
We seem to be on weather cloud 10.
Please advise on how we can receive free upgrade
Hi Nigel, the Weathercloud site is always updated automatically to the latest version, so there’s nothing you need to do. You can see the current version number in the footer of the site.
Hi.
Thanks for the great news. :-)
However, when I look at any weather stations in Denmark (including mine https://app.weathercloud.net/d3757262361#profile), I don’t see the forecast at all.
It just says “Forecast not available at this moment” after spinning for a while.
Is it not working for Denmark, or did I miss something about a paid feature?
Hi Tupsy, The forecast information for Denmark comes from the Danish Meteorological Institute (DMI). Occasionally, their system doesn’t respond in time (a “time out”), which is why the forecast may not appear on Weathercloud for your location at certain times. This is not an issue with your account or device, it happens on DMI’s side, and we display the data as soon as it becomes available. Thank you for your understanding!
Where can I find the latest extension file (weewx-wcloud-x.y.tgz)? The link under “Linking instructions” does not appear to work, as there is no obvious file at that location to download.
Hi Michael, it seems that the developer has changed the location of the file. We recommend contacting them directly for support, as they can provide the most up-to-date download link and guidance for installation.
Witam a czy na Polskich stronach też jest aktualizacja?
Hi x44, all changes are available on the Polish version as well as on other language versions.
Just tried the annual data download and it hasn’t come as a single cab but a zip file with 12 files in, so I’ll still have to merge them together into a single file.
Hi Geoff, at present, annual downloads are provided as a zip file containing one CSV file per month. We understand that having everything combined into a single file could be more convenient for some users, and we’ll keep this suggestion in mind for future improvements.
Improvements are looking good but sadly, the adverts are too much and are totally taking over the page. I appreciate for the basic plan that adverts help to monetise your platform and I would happily accept “pop ups” but in its current form their are two separate areas on a page containing adverts which I think are a bit overkill. At the moment, it still isn’t enough to “fully” sway me over from another competitors paid program. Heading in the right direction though.
I have. VEVOR 7/1 Weather Station that I need to link up but it’s not listed. It is registered but I can’t get any further. Help me please
Hi Mike, VEVOR devices, even if not specifically listed, can connect to Weathercloud through the Pro Weather Link firmware integrated into the device console. If you need any assistance connecting your device to our platform, please don’t hesitate to reach out to our Support team using this form.
Hi Mike, VEVOR devices, even if not specifically listed, can connect to Weathercloud through the Pro Weather Link firmware integrated into the device console. If you need any assistance connecting your device to our platform, please don’t hesitate to reach out to our Support team using this form.
Bonjour
Puis-je envoyer les enregistrements météo de ma station météo sur mon portable ou smartphone
Merci de m’indiquer comment
Bonjour Duthin, une fois votre appareil connecté au site Weathercloud, vous pouvez accéder à vos données météo depuis n’importe quel ordinateur, smartphone ou tablette via un navigateur web.
Very good features in the version!
Reports with min/max values every day would be more interesting as an average value. Perhaps in the next version?
Hi Bobby, the daily reports included in the Basic plan already display the minimum and maximum values for the selected day, highlighted at the top of each column.
For Pro and Premium plans, the monthly PDF reports show the minimum and maximum values for each day of the month, rather than just the overall minimum and maximum for the period, as in the Basic plan’s monthly report.
Clicking on the coordinates on a profile loads a map of North Africa. In Chrome it then zooms out and into the location over a few seconds, but in Firefox this seems to be broken. Although it does seem to happen occasionally after a random amount of time, anything from a few seconds to 30 seconds or more, I can’t tell what the trigger is (if anything).
It would be better if it just opened a map in the correct location to begin with, there’s no reason for us to watch this flight from North Africa every time.
Hi Robert, thank you very much for bringing this to our attention. We’ve passed your feedback to the relevant team for review.
great how do i download it?
Hi, since Weathercloud is a cloud-based platform, you don’t have to worry about downloads. We update the platform automatically, so the latest version is always waiting for you whenever you sign in.