Weathercloud Beta 4 Released!

Today we’re so happy to announce the release of Weathercloud Beta 4, one of the biggest updates so far. It’s been a while since we released Beta 3, and in that time the team has been really hard at work, developing new and exciting features, fixing a number of bugs and enhancing the overall performance of the network for you to enjoy. Let’s take a look at the highlights of this new version:
What’s New in Beta 4
METAR Devices
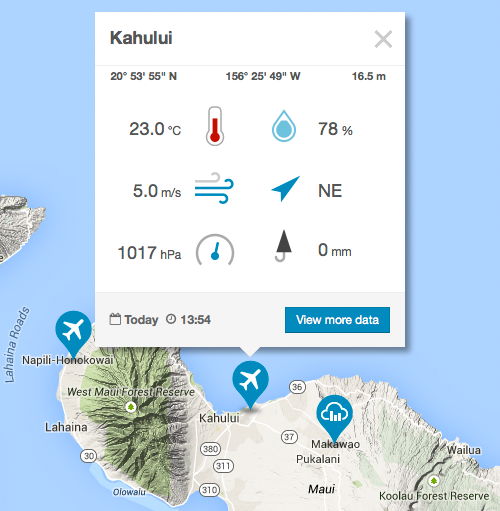
The weather map now displays over 3,000 METAR devices from all around the world! METAR (METeorological Aerodrome Report) is a standard format for reporting weather information, and it’s used by official weather stations installed at airports and similar locations. A METAR device is, therefore, a weather station using this format to make its weather information available to the public at specific intervals. Thanks to this addition, you can now easily check the accuracy of your data against a 100% reliable airport station located nearby on the map. The location of a METAR device is indicated by a new airplane icon, as shown below:
Total Cumulative Rainfall
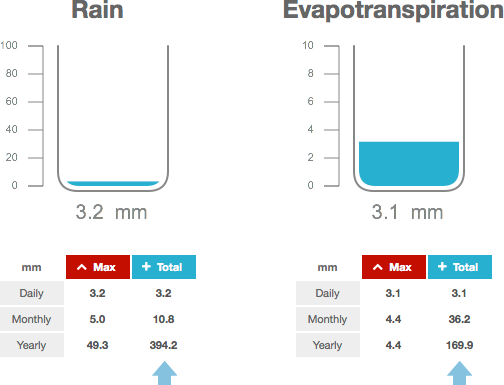
This has been one of the most requested features, and we’re happy to bring it to you in Beta 4. Now the Rain and Evapotranspiration gauges do not only display the total rainfall of the rainiest day of the month and year, but also the total cumulative rainfall for the day, month and year in a new column.
New Offline Scenario
We’ve made significant changes in the way the offline state plays out. From now on, a device will go into this state after 1 hour without having uploaded any data, instead of 2 days as before. It will still be visible on the weather map, but the time of last update will be shown in red. However, if the device remains offline for 24 hours, then it will leave the map until new data is sent. We’ll inform you if your device goes offline or stops being shown on the map as long as your email notifications are enabled in the Settings page. With these changes we want to guarantee that only current data is shown on the map, as well as put in value your effort in taking care of your device.
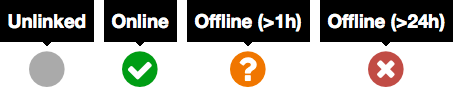
Additionally, we’ve redefined the colors of the different device states and map markers in order to better represent their meaning. From the feedback we receive, you’ll surely appreciate that the red pin is no longer being used to indicate your device :) Be sure to check our FAQ page for more information about the meaning of the different colors.
Fully Available Database and Plots
After a period of maintenance due to performance issues, we’re glad to announce that all options in the Database and Plots pages are available again. We’ve worked hard during this time to significantly improve the speed and efficiency when you view your historical database or create custom plots, and we’re sure that you’ll notice a big difference right away. Enjoy!

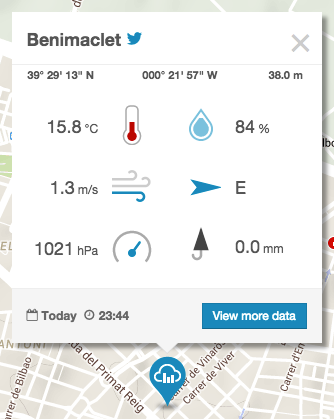
Link to Your Twitter Profile
If you’re using our feature to tweet your weather data automatically, then a link to your Twitter profile will be displayed next to the name of your device. In this way, other Weathercloud users can give you a follow and see your weather updates directly from their timeline. Likewise, you can check out the Twitter profile of other weather enthusiasts and follow them if you like.
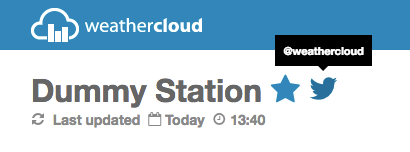
This new link to your Twitter profile is also displayed in the infoboxes.
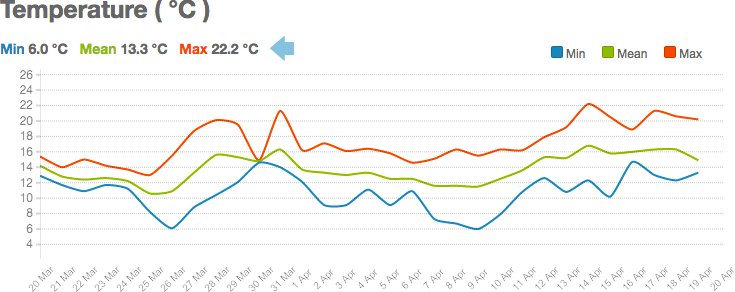
Minimum, Average and Maximum Values in Evolution Tab
This new time-saving feature shows the minimum, average and maximum values for the last month above each graph of the Evolution tab. In the case of the rain, you’ll also see the total cumulative value for the same period.
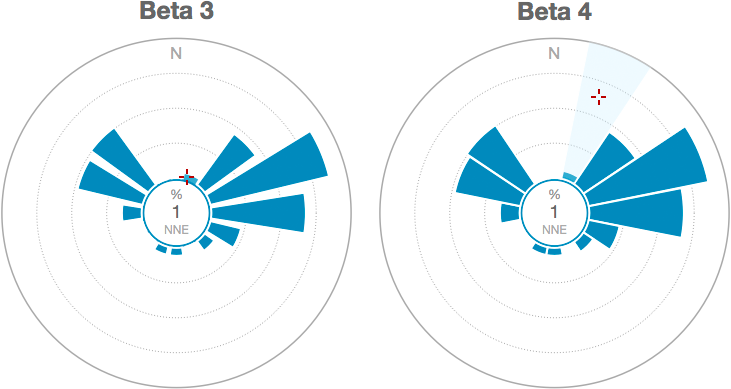
Enhanced Wind Rose Diagrams
In Beta 4 the wind rose diagrams are even better than before! You can now view data for a specific segment by placing the mouse anywhere over its quadrant (e.g. NNE), rather than having to place it over the segment itself. This is especially convenient when segments are too small, as we show you below. Also, the effect of the quadrants illuminating when mousing over them looks really cool!
Other minor bug fixes and improvements:
- Added an About page.
- Added (UTC+01:00) Berlin to the time zone list.
- Added 3 custom error pages.
- Added hash marks to the Profile, Current, Wind and Evolution tabs to let you link directly to them.
- Fixed an issue when disabling the Email notifications.
- Improved capture of WeatherLink Network data.
- Improved responsiveness in mobile devices.
- Larger close button in the infoboxes for better usability in touch devices.
- Several performance enhancements.
- Translated the cardinal directions into all supported languages.
- Updated the FAQ page with all the latest information.
We’d love to hear your thoughts about the new features and changes introduced in Beta 4, so please drop a comment below and share them with us. Also, feel free to give us feedback if you spot a bug or think that something isn’t working as it should. Thanks so much!


Love the improvements in Beta 4! This is a very nice set of changes. One minor item, on the Wind gauges page, I notice that although the correct information displays as to time of last update, the date for the wind distribution gauges is yesterday. Does this mean those gauges are not providing current wind distribution, but are displaying what happened during the previous day?
That’s right John, the wind rose diagrams display data for the previous day, since they’re generated from the 24 hours of the last day.
I’d love to be able to track evapotranspiration from my Davis Pro 2 Plus, but even thought it is a selected variable and is sending you data via Meteobridge, evapotranspiration is grayed out in my panel. Hopefully this is just temporary. Otherwise, great update! Station KTXLEWIS26.
Hi Toby, currently Meteobridge doesn’t send evapotranspiration data.
The developer of Meteobridge told me he would love to add the functionality of sending ET values to WeatherCloud, but needs you to give him a specification on how to add this data to the specific uploads for these services. Thanks, and all the best!
Great! We have already contacted the developer of the Meteobridge in case he needs our help.
Is the beta version available for download? I have not been able to find a link.
Hello Paul, we have updated the Weathercloud site, so you don’t need to download anything to access the latest version.
Bonjour
je n’arrive franchement pas a comprendre comment cela fonctionne j’arrive a rien ni a lier ma console davis vantage
ni a mon site web et encoremoins a votre site
ilmanque des données de configuration ( french version )
Bonjour Meteo thenioux, pour connecter votre appareil via WeatherLink Network vous devez entrer votre nom d’utilisateur et mot de passe WeatherLink Network, comme indiqué ici: https://weathercloud.net/info/weatherlinknetwork
Au lieu de cela, si vous voulez connecter votre appareil grâce à un logiciel météo, vous devez aller à la page Devices (Dispositifs) et cliquez sur Edit device (Modifier dispositif) dans le menu déroulant (l’icône d’engrenage) pour obtenir votre ID et Key. Vous pouvez consulter notre page FAQ pour plus de détails: https://weathercloud.net/site/faq#faq-compatibility
no puedo ver la velocidad del viento ni la dirección con el programa weathersnoop 3
Hola Josep, lo que nos comentas se debe a que WeatherSnoop 3 no envía dichos datos a nuestra red. Ya informamos al autor del programa sobre este bug para que pueda corregirlo en la próxima versión.
Tengo que corregir un dato de lluvia erróneo que se produjo durante el montaje de mi estación. Como puedo modificar los valores?
Hola Ignacio, actualmente no es posible editar valores almacenados en la base de datos, aunque estamos valorando dicha posibilidad. Lo más recomendable es desconectar el pluviómetro durante los trabajos de instalación y mantenimiento para evitar que se registre lluvia a causa de movimientos involuntarios del balancín.